Google Analytics (GA) provides many important, detailed blog traffic statistics to you as a blogger as you strive to fine tune your blog into the most efficient engine it can be. This information is especially helpful to web analysts and for marketing purposes.
As one of the most popular, user friendly and free web-based services for analytics available, GA uses JavaScript embedded into site pages to give statistical traffic information. This works differently than information you would get through other web statistics programs, such as Webalizer or AWStats, which gather information through a web server log. As a free service, GA is quite capable of providing site statistical information you can use to streamline your site.

On the other hand, unfortunately users that have JavaScript disabled in their browsers will not be included in the traffic statistics provided. Also, because it is a free service, there is limited support and the speed at which the data is gathered is somewhat delayed as opposed to real-time programs. However, there are some excellent paid services available such as Webtrends and Adobe SiteCatalyst (Omniture) if your budget will support the cost.
Google Analytics Dashboard
This dashboard allows you to change the arrangement of the statistics, as well as add or remove any of the statistics displayed. The default setting analyzes data from the previous 30 days. However, this date range can be customized and you can do comparisons of date ranges if desired.
The report displays main categories such as:
- Goals Overview – Gives full statistics that can be customized to show the results of performance goals assigned, and it allows you to map out exactly what your viewers will be doing on the site. This means on an e-commerce site for example, you can track viewers and assign values as they proceed through each step in the purchase process.
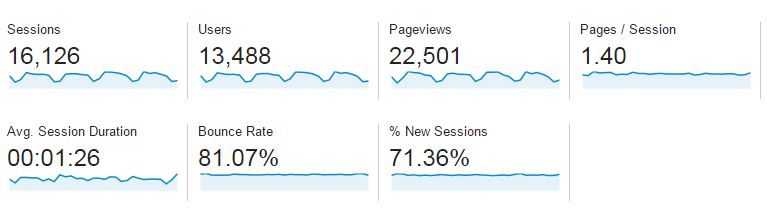
- Site Usage – Site Usage is broken down into subcategories, which in turn can be clicked to show more details and information gathered within the time period specified:
- Pageviews – Shows how many pages each viewer visited.
- Visits – Shows the total amount of visits or traffic to your blog or website.
- Page/Visit – Gives an average of the amount of pages visited by viewers.
- Average Time on Site – Tracks the average time each viewer stays on your blog or website.
- % New Visits – Filters and gives a percentage of new viewers rather than repeat viewers in the total amount of visits.
- Bounce Rate – Shows a percentage of viewers that left your blog, or “bounced,” after viewing one page. It’s important to remember there are a lot of reasons why only one page might be viewed. These reasons can include finding your site by mistake when they were searching for another page or you may have an image or file hosted that is viewed on its own, negating a reason for viewers to actually visit and surf through the entire site.
- Traffic Sources Overview – Shows what sources is directing traffic to your blog, whether through search engines using keywords, from direct URL visits or through referral links.
- Visitors Overview – Gives the same statistics as Site Usage and also provides data such as Absolute Unique Visitors, as well as a Technical Profile section, which gives statistics on connection speeds and specific browsers that viewers to your site are using.
- Keywords – Shows both paid and non-paid keywords that viewers are using in search engines to get to your blog. It shows the value of each keyword by giving the viewer information from each, showing average pages per visit, time spent on the site and conversion rates.
- Content Overview – Gathers and shows statistics on the most popular pages visited on your blog. It gives details on the amount of page views, unique page views, average time spent on any specific page, bounce rates showing the percentage of single page visits, exit percentages showing the percentage of exits from any given page, and $ Index which is calculated if a value has been set on any page in your Goals section.
- Map Overlay – Displays a visual report giving statistics on the geographical area of each viewer. This report is clickable and will give more specific details broken down into country, city, etc.
All of the statistics above are freely accessible from Google Analytics. It is possible to fully customize them as well by setting filters to get specific information for segments of viewers. These filters are found in the Advanced Segments option. Also, using Site Overlay, you can view statistics on links viewers used to arrive to your site. In addition, there are many more statistics available that will allow you to arrive at the information and data you specifically require for your site.
Keeping in mind still that it will not provide information for users with JavaScript disabled, GA is still a great tool that can give plenty of information from generalized traffic statistics for viewers, to highly detailed information for specific viewers. By using a combination of web server log statistics and a web-based analytics program such as GA, you will get a more complete and accurate picture of viewers to your blog or website, which will help you with determining the right strategy to gain the traffic you need for a profitable business.
This is a guest post by Jake Dickson. Jake Dickson is the owner of 24 Hour Locksmith Miramar FL,24 Hour Locksmith Coral Springs FL and 24 Hour Locksmith Pompano Beach FL. If you want to guest post on Better Start Blogging blog, check out the guidelines here.

